
本文旨在剖析系统CPU性能的指标:CPU使用率。
0x00 前言
回顾前面,学习了以下描述系统情况的方式:
而描述CPU,可以直接使用CPU使用率。
0x01 什么是CPU使用率
Linux身为多任务操作系统,靠的是短时间片(CPU时间的最小单位)+调度器(轮流分配)。
短时间片:事先约定来触发中断的节拍率(HZ),并使用Jiffies记录开机依赖节拍数。
1
2
# cat /proc/timer_list|grep -m1 -E '^jiffies'|cut -d" " -f2
7604634289节拍率(HZ):不同发行版会有不同的内核预设值,意味每秒钟触发的时间中断次数。
1
2
3
4
[root@rhel7 ~]# grep 'CONFIG_HZ=' /boot/config-$(uname -r)
CONFIG_HZ=1000
ubuntu@localhost:~$ grep 'CONFIG_HZ=' /boot/config-$(uname -r)
CONFIG_HZ=250而用户空间往往使用的是USER_HZ,任何运行时kernel的编译选项都可以使用getconf进行显示,这个值被固定为100,也就是1秒中断100次。
$ man 7 time
…
The software clock, HZ, and jiffies
The accuracy of various system calls that set timeouts, (e.g., select(2), sigtimedwait(2)) and measure CPU time (e.g., getrusage(2)) is limited by the resolution of the software clock, a clock
maintained by the kernel which measures time in jiffies. The size of a jiffy is determined by the value of the kernel constant HZ.
The value of HZ varies across kernel versions and hardware platforms. On i386 the situation is as follows: on kernels up to and including 2.4.x, HZ was 100, giving a jiffy value of 0.01 seconds;
starting with 2.6.0, HZ was raised to 1000, giving a jiffy of 0.001 seconds. Since kernel 2.6.13, the HZ value is a kernel configuration parameter and can be 100, 250 (the default) or 1000, yield‐
ing a jiffies value of, respectively, 0.01, 0.004, or 0.001 seconds. Since kernel 2.6.20, a further frequency is available: 300, a number that divides evenly for the common video frame rates (PAL,
25 HZ; NTSC, 30 HZ).
The times(2) system call is a special case. It reports times with a granularity defined by the kernel constant USER_HZ. User-space applications can determine the value of this constant using
sysconf(_SC_CLK_TCK).1
2
3
4[root@rhel7 ~]# getconf CLK_TCK
100
ubuntu@localhost:~$ getconf CLK_TCK
100
Linux通过伪文件系统 /proc来向用户提供OS内部状态信息,而/proc/stat 提供了系统的CPU和系统任务统计信息。
1
2
3
4
5
6
7
8
9
10
11
12
13
14
15
16
17
18
19
20
21
22
23# 重点查看不同场景下CPU的累计节拍数。
[root@rhel7 ~]# cat /proc/stat |grep ^cpu
cpu 34606696 176287 4467987 6580945956 1271138 0 43622 0 29486561 0 <<< 总体累加值
cpu0 595076 20722 276949 329973186 13384 0 13257 0 362976 0
cpu1 1127636 67877 201993 328548578 930793 0 18742 0 756795 0
cpu2 1263945 20524 166542 329398032 229204 0 34 0 1069117 0
cpu3 2598239 8315 279844 328137468 39873 0 33 0 2418959 0
cpu4 3152236 4124 276053 327627575 9873 0 16 0 2983401 0
cpu5 3758087 1714 254151 327048933 4333 0 11 0 3607109 0
cpu6 3694695 2045 240707 327126810 3759 0 17 0 3554974 0
cpu7 3828972 4117 240018 326989822 3392 0 21 0 3688237 0
cpu8 3905215 3004 243946 326913132 2545 0 7 0 3765278 0
cpu9 4009330 1172 246768 326807704 2270 0 19 0 3870190 0
cpu10 554056 9355 214524 330129039 442 0 11371 0 159670 0
cpu11 533244 15006 200194 330390188 4311 0 1 0 187749 0
cpu12 540121 6568 190984 330403882 545 0 2 0 203736 0
cpu13 643304 2944 196357 330296946 338 0 2 0 345497 0
cpu14 895960 1370 199230 330038803 260 0 1 0 620911 0
cpu15 671360 1116 202075 330264781 374 0 2 0 370423 0
cpu16 778120 3359 209582 330147575 276 0 3 0 463865 0
cpu17 582231 757 203751 330350880 299 0 0 0 295223 0
cpu18 836571 669 215387 330086448 291 0 3 0 495057 0
cpu19 638288 1522 208925 330266164 24565 0 70 0 267386 0其含义:
$ man proc
…
/proc/stat
kernel/system statistics. Varies with architecture. Common entries include:
cpu 3357 0 4313 1362393
The amount of time, measured in units of USER_HZ (1/100ths of a second on most architectures, use sysconf(_SC_CLK_TCK) to obtain the right value), that the system spent in various
states:
user (1) Time spent in user mode.
(缩写为us)用户态时间,不含nice,但包含guest。
nice (2) Time spent in user mode with low priority (nice).
(缩写为ni)低优先级用户态时间,取值范围-20 -19,数值越大优先级越低。
system (3) Time spent in system mode.
(缩写为sys)内核态CPU时间。
idle (4) Time spent in the idle task. This value should be USER_HZ times the second entry in the /proc/uptime pseudo-file.
(缩写为id)空闲时间,不含IO等待(iowait),/proc/uptime第二个值的100倍。
iowait (since Linux 2.5.41)
(5) Time waiting for I/O to complete.
(缩写为wa),代表等待I/O的CPU时间。
irq (since Linux 2.6.0-test4)
(6) Time servicing interrupts.
(缩写为hi),代表硬中断的CPU时间。
softirq (since Linux 2.6.0-test4)
(7) Time servicing softirqs.
(缩写为si),代表软中断的CPU时间。
steal (since Linux 2.6.11)
(8) Stolen time, which is the time spent in other operating systems when running in a virtualized environment
(缩写为st),代表vm系统被其他vm抢占的CPU时间。
guest (since Linux 2.6.24)
(9) Time spent running a virtual CPU for guest operating systems under the control of the Linux kernel.
(缩写为guest),代表作为hypervisor运行虚拟机的CPU时间。
guest_nice (since Linux 2.6.33)
(10) Time spent running a niced guest (virtual CPU for guest operating systems under the control of the Linux kernel).
(缩写为gnice),代表作为低优先级运行虚拟机的时间。因此我们可以有了CPU使用率的计算公式:

但是Linux开机很久以来的时间也纳入计算,明显没有意义,因此我们常用的是优化版:

系统的角度考量的是/proc/stat , 而进程的角度考量的是/proc/[pid]/stat 。
而常见的分析工具top(3秒时间间隔)和ps(进程全生命周期)都可以帮我们计算好,我们只需要注意它们的时间间隔。
0x02 怎么查看CPU使用率
top:
系统的资源(总体CPU和内存)使用情况。
进程的资源(不区分用户态/内核态)使用情况。
1
2
3
4
5
6
7
8
9
10
11
12
13
14
15
16
17
18
19
20
21
22
23top - 09:03:15 up 2 days, 8:11, 3 users, load average: 0.00, 0.03, 0.05
Tasks: 466 total, 1 running, 465 sleeping, 0 stopped, 0 zombie
%Cpu(s): 0.1 us, 0.1 sy, 0.0 ni, 99.8 id, 0.0 wa, 0.0 hi, 0.0 si, 0.0 st
KiB Mem : 13172561+total, 12070921+free, 5016792 used, 5999608 buff/cache
KiB Swap: 4194300 total, 4194300 free, 0 used. 12589456+avail Mem
(用户态%CPU+内核态%CPU)
PID USER PR NI VIRT RES SHR S %CPU %MEM TIME+ COMMAND 2147 root 20 0 1462688 20152 5340 S 0.3 0.0 0:37.21 docker-containe
3953 root 20 0 23164 2688 1312 S 0.3 0.0 5:00.06 tmux
1 root 20 0 191856 4860 2644 S 0.0 0.0 0:02.15 systemd
2 root 20 0 0 0 0 S 0.0 0.0 0:00.01 kthreadd
4 root 0 -20 0 0 0 S 0.0 0.0 0:00.00 kworker/0:0H
6 root 20 0 0 0 0 S 0.0 0.0 0:01.66 ksoftirqd/0
7 root rt 0 0 0 0 S 0.0 0.0 0:00.19 migration/0
8 root 20 0 0 0 0 S 0.0 0.0 0:00.00 rcu_bh
9 root 20 0 0 0 0 S 0.0 0.0 0:07.40 rcu_sched
10 root 0 -20 0 0 0 S 0.0 0.0 0:00.00 lru-add-drain
11 root rt 0 0 0 0 S 0.0 0.0 0:00.12 watchdog/0
12 root rt 0 0 0 0 S 0.0 0.0 0:00.10 watchdog/1
13 root rt 0 0 0 0 S 0.0 0.0 0:00.18 migration/1
14 root 20 0 0 0 0 S 0.0 0.0 0:00.27 ksoftirqd/1
16 root 0 -20 0 0 0 S 0.0 0.0 0:00.00 kworker/1:0H
17 root rt 0 0 0 0 S 0.0 0.0 0:00.10 watchdog/2
18 root rt 0 0 0 0 S 0.0 0.0 0:00.53 migration/2
ps:进程的资源(区分用户态/内核态)使用情况。
1
2
3
4
5
6
7
8
9
10
11
12
13
14
15
16
17
18
19
20
21
22
23
24[root@rhel7 ~]# pidstat 1 5
Linux 3.10.0-1160.11.1.el7.x86_64 06/20/2021 _x86_64_ (20 CPU)
用户态 内核态 虚拟机 等待 总使用率
CPU使用率 CPU使用率
12:10:18 AM UID PID %usr %system %guest %wait %CPU CPU Command
12:10:19 AM 1000 206 0.00 6.00 0.00 0.00 6.00 0 tmux: server
12:10:19 AM 1000 17722 0.00 1.00 0.00 0.00 1.00 0 pidstat
12:10:19 AM UID PID %usr %system %guest %wait %CPU CPU Command
12:10:20 AM 1000 206 0.00 8.00 0.00 0.00 8.00 0 tmux: server
12:10:20 AM UID PID %usr %system %guest %wait %CPU CPU Command
12:10:21 AM 1000 206 1.00 6.00 0.00 0.00 7.00 0 tmux: server
12:10:21 AM UID PID %usr %system %guest %wait %CPU CPU Command
12:10:22 AM 1000 206 0.00 10.00 0.00 0.00 10.00 0 tmux: server
12:10:22 AM UID PID %usr %system %guest %wait %CPU CPU Command
12:10:23 AM 1000 206 0.00 7.00 0.00 0.00 7.00 0 tmux: server
Average: UID PID %usr %system %guest %wait %CPU CPU Command <<< 5组平均值
Average: 1000 206 0.20 7.40 0.00 0.00 7.60 - tmux: server
Average: 1000 17722 0.00 0.20 0.00 0.00 0.20 - pidstat
0x03 CPU使用率过高怎么办?
答:直接查找占用的函数进行优化。
GDB(中断程序进行调试)
perf(不中断程序进行调试)
1
2
3
4
5
6
7
8
9
10
11
12
13
14
15
16
17
18
19
20
21
22
23
24
25
26
27
28
29
30
31
32
33
34
35
36$ perf top
Samples: 2K of event 'cycles', 4000 Hz, Event count (approx.): 1591275795 lost: 0/0 drop: 0/0
共2k个CPU时钟事件 总事件数1591275795
采样率 函数共享对象/类型 函数名,符号名
Overhead Shared Object Symbol
5.45% [kernel] [k] module_get_kallsym
3.84% [kernel] [k] page_fault
3.53% libc-2.17.so [.] __gconv_transform_utf8_internal
3.19% libc-2.17.so [.] __mbrtowc
2.55% libc-2.17.so [.] _int_malloc
2.06% [kernel] [k] kallsyms_expand_symbol.constprop.1
2.01% libc-2.17.so [.] __GI_____strtoull_l_internal
1.74% libc-2.17.so [.] __strcmp_sse42
1.64% [kernel] [k] format_decode
1.62% libc-2.17.so [.] _int_free
1.31% [kernel] [k] __memcpy
1.23% perf [.] __dso__load_kallsyms
1.21% libc-2.17.so [.] __strcpy_sse2_unaligned
1.20% perf [.] rb_next
1.09% [kernel] [k] vsnprintf
1.05% libc-2.17.so [.] __strlen_sse2_pminub
0.95% libc-2.17.so [.] malloc
0.90% [kernel] [k] acpi_processor_ffh_cstate_enter
0.90% [kernel] [k] delay_tsc
0.88% perf [.] 0x00000000000d67a4
0.87% libc-2.17.so [.] __memcpy_sse2
0.86% [kernel] [k] handle_mm_fault
0.83% libc-2.17.so [.] _IO_feof
0.82% [kernel] [k] number.isra.2
0.72% [kernel] [k] strnlen
0.70% perf [.] rb_insert_color
0.63% [kernel] [k] copy_page_rep
0.61% libc-2.17.so [.] __ctype_get_mb_cur_max
0.59% libc-2.17.so [.] _dl_addr
0.59% [kernel] [k] string.isra.7
0.59% [kernel] [k] strnlen_user
第一组示范:
- 环境准备:
1 | $ docker run --name nginx -p 10000:80 -itd docker.io/feisky/nginx |
- 压测:
1 | 这里使用其他客户端配合 |
1 | [root@rhel7 ~]# top |
第一组分析
- 初步分析:
1 | 可以见到由于依赖路径不一,只能看到十六进制内容。 |
- 保存一个进程的记录,拷贝进入容器内分析:
1 | [root@rhel7 ~]# perf record -g -p 6763 |
- 光标选中后回车进入,逐一检视← →
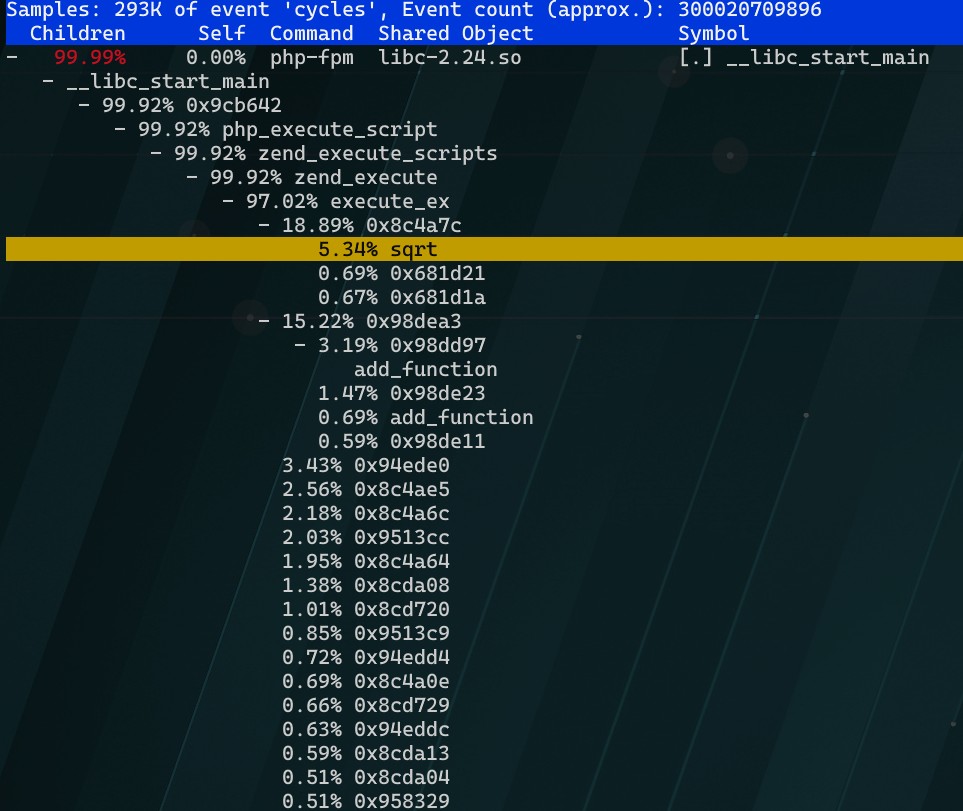
- 基本得出结果了,源码核实一下
1 | [root@rhel7 ~]# docker cp phpfpm:/app . |
- 修复
1 | [root@rhel7 ~/app]# cat index.php |
- 测试一下修复结果
1 | [root@rhel7 ~]# docker rm -f nginx phpfpm |
1 | $ ab -c 10 -n 10000 http://192.168.99.79:10000/ |
第二组示范
- 环境准备:
1 | $ docker rm -f nginx phpfpm |
- 压测:
1 | 这里使用其他客户端配合 |
换一个时间比较长的进行压测方便观察。
1 | $ ab -c 5 -t 600 http://192.168.99.40:10000/ |
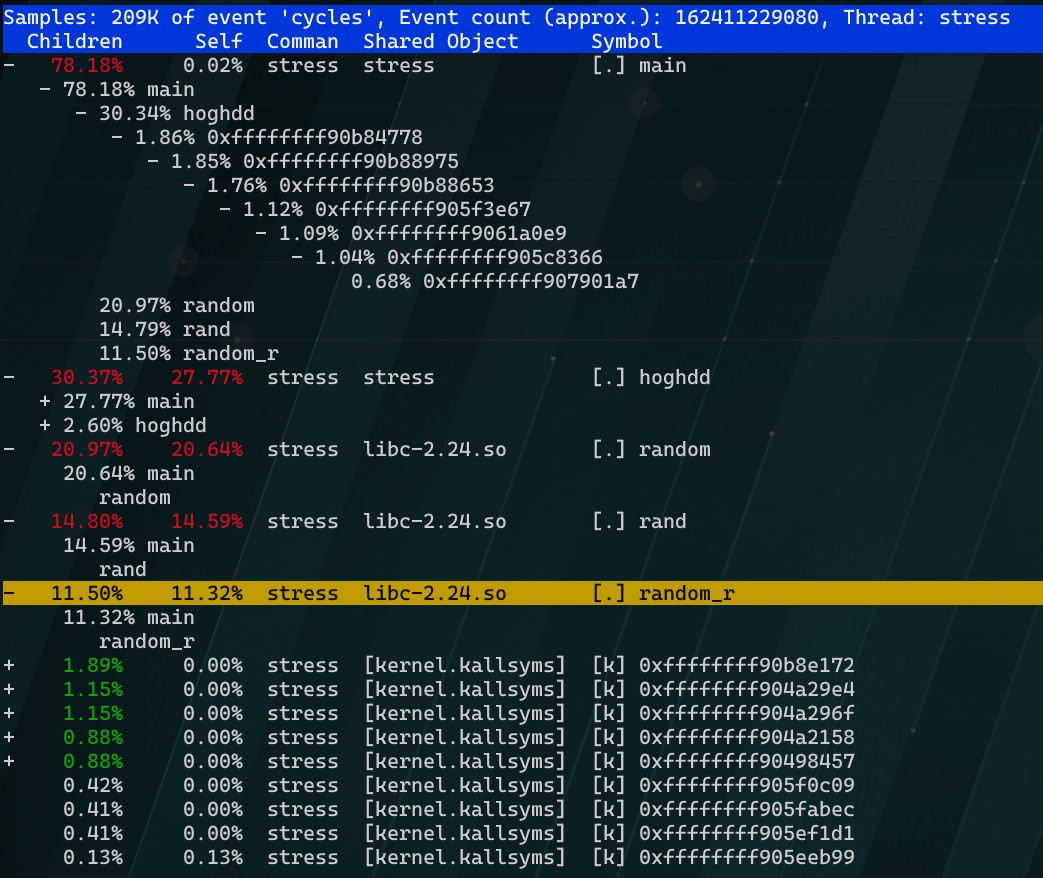
可以观察到处于R (Running) 的php-fpm 与 总running 数目有所出入, 而其他处于R的进程是stress
1 | [root@rhel7 ~]# top |
pidstat不能抓到转瞬即逝的这些进程,我们转用pstree |grep stress
1 | $ watch -d -n 1 "pstree |grep stress" |
第二组分析
查找源码
1
2
3
4
5
6
7
8
9
10
11
12
13
14
15$ docker cp phpfpm:/app .
$ grep stress -r app
app/index.php:// fake I/O with stress (via write()/unlink()).
app/index.php:$result = exec("/usr/local/bin/stress -t 1 -d 1 2>&1", $output, $status);
$ cat app/index.php
<?php
// fake I/O with stress (via write()/unlink()).
$result = exec("/usr/local/bin/stress -t 1 -d 1 2>&1", $output, $status);
if (isset($_GET["verbose"]) && $_GET["verbose"]==1 && $status != 0) {
echo "Server internal error: ";
print_r($output);
} else {
echo "It works!";
}
?>通过源码带的接口调试结果
1
2
3
4
5
6
7
8
9
10
11看错误消息 mkstemp failed: Permission denied ,以及 failed run completed in 0s。原来 stress 命令并没有成功,它因为权限问题失败退出了
$ curl "http://192.168.99.40:10000?verbose=1"
Server internal error: Array
(
[0] => stress: info: [74139] dispatching hogs: 0 cpu, 0 io, 0 vm, 1 hdd
[1] => stress: FAIL: [74140] (563) mkstemp failed: Permission denied
[2] => stress: FAIL: [74139] (394) <-- worker 74140 returned error 1
[3] => stress: WARN: [74139] (396) now reaping child worker processes
[4] => stress: FAIL: [74139] (400) kill error: No such process
[5] => stress: FAIL: [74139] (451) failed run completed in 0s
)perf分析
1
2
3
4
5
6
7
8确保软连接开启
光标选中后回车进入,逐一检视← →
0x04 总结
- 从
/proc/stat可以得知CPU使用率的类型,其排查思路如下:- CPU和Nice升高,排查用户态进程。
- 系统CPU升高,排查内核线程或者系统调用。
- I / O 等待CPU升高,排查系统存储。
- 软中断和硬中断升高,说明中断操作占用,排查内核中断服务程序。
- pidstat和top各有所长。
- perf可以在不中断进程的情况下收集证据。
- 转瞬即逝的进程,不停地崩溃重启,也有可能影响性能表现,通过perf top来搭配观察。